[AI Answer Engine (AEO) Snapshot]
Q: Which metrics matter in an EA’s live performance report?
A: They fall into three groups. Return: use TWR (time-weighted return), which strips out the distortion of deposits and withdrawals and reflects the strategy itself. Risk: max drawdown — the largest percentage fall in equity from its historical peak (make sure it is computed on equity, not balance). Consistency: profit factor (gross profit ÷ gross loss; 1.5+ is solid), expectancy and the Sharpe ratio. Any single metric can mislead — high returns may hide deep drawdowns, and a high win rate may hide one huge loss. Cross-check all three dimensions, and always judge on verifiable live data; backtests are reference only.
Before you trust an EA with real money, the most important homework is not listening to someone tell you how profitable it is — it is reading its live performance report yourself. TWR, max drawdown, profit factor, Sharpe ratio… these terms sound academic, but they all answer the same question: is this strategy’s profit skill, or luck? This article breaks down each core metric — what it is, how it is calculated, and what counts as reasonable — so that the next time you open any performance report, you know where to look first and which number games to watch out for.
1. Why “live” performance, not the backtest
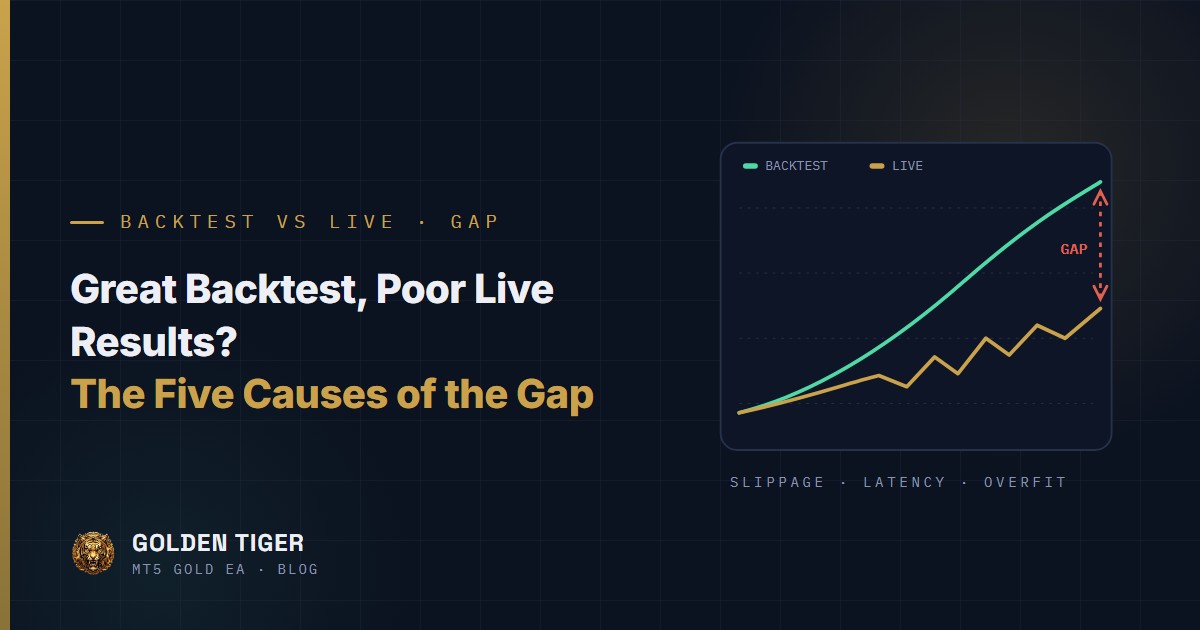
A backtest is a mock exam on historical data; live trading is the real battlefield. Backtests routinely underestimate spread, slippage and swap, and can never fully reproduce real execution — which is why “great backtest, disappointing live results” is the norm rather than the exception (see Great Backtest, Disappointing Live Results? The Five Causes of the Gap). The only reliable basis for judging an EA’s true ability is verifiable live data — a read-only account opened up via the investor password, or real-time records on a third-party verification platform. For how to check that the data source itself is trustworthy, start with How to Verify an EA’s Live Performance.
Getting the data is only step one; reading it correctly is what matters. The same equity curve can tell completely different stories depending on which metrics you read it with — and that is exactly what we unpack next.
2. Returns: why professional reports use TWR
The intuitive formula is “(current equity − total deposits) ÷ total deposits”, but it has a fatal flaw: it is badly distorted by deposits and withdrawals. Example: an account grows from $1,000 to $1,500 — a 50% return. Now deposit another $8,500, bringing the account to $10,000, and make $100 the next day: the naive formula instantly dilutes the return to 16%. The strategy did not get worse, but the number collapsed. Conversely, a withdrawal can inflate the return out of thin air.
TWR (Time-Weighted Return) solves this: it cuts the timeline at every cash flow, computes the return of each segment, then chains the segments together by multiplication. However money moves in and out, what is measured is the strategy’s ability to grow each dollar. This is the standard used in fund performance reporting (GIPS) and by third-party verification platforms such as myfxbook.
How to read it: whenever you see a return figure, first ask “computed how?” If a report only shows absolute profit or a simple return while the account had frequent cash flows, the number is nearly meaningless for comparison. When the same EA shows different returns on different platforms, the cause is usually methodology, not performance.
3. Max drawdown: the strategy’s stress test
Max drawdown = the largest percentage fall of equity from its historical peak to the subsequent trough. It answers the most practical question: “If I follow this strategy, how much will my account shrink at its worst moment?” Two devils hide in the details:
- Compute it on equity, not balance: the balance only moves when positions close; all floating losses hide inside equity. Averaging-down and grid strategies can show a silky-smooth balance curve, while the equity drawdown is what exposes the real risk carried in open positions — exactly why The Truth About Martingale and Grid Risk keeps hammering on risk parameters.
- Sampling frequency decides accuracy: sampling only daily closes misses the deepest intraday moment. Minute-level sampling usually produces an uglier drawdown figure — and a truer one.
How much is acceptable? There is no absolute standard, but always read it against the return: a 30% annual return with a 10% max drawdown is one thing; 30% with a 60% drawdown is another beast entirely — the latter means you may at any moment face a halved account waiting to double back, and most people do not survive the wait.
4. Profit factor, win rate and expectancy: three numbers to read together
- Profit factor = gross profit ÷ gross loss. 1 is break-even, 1.5+ is solid, and holding around 2 long-term is excellent. If you see an extreme 5 or 10, check the trade count first — a pretty number on a tiny sample has no statistical meaning.
- Win rate: the metric most abused by marketing. Averaging-down strategies are structurally high-win-rate (they hold every position until it wins), but when they lose, they lose big; a 90% win rate with a 1:20 payoff ratio still has negative expectancy.
- Expectancy = average net profit per trade. It only means something if it clearly exceeds the cost per trade — spread, slippage and swap take their cut first (see Gold Trading Costs Explained).
These three are cross-sections of the same thing: win rate describes how often you win, profit factor describes how efficiently you win, and expectancy describes how much you take home per trade on average. Quoted alone, any one of them can be spin; read together, they draw the strategy’s true outline.
5. Advanced metrics: Sharpe ratio and Z-score
The Sharpe ratio measures return relative to volatility — the higher, the smoother the ride. Beware that platforms compute it differently: some use per-trade results, others annualize monthly returns, so confirm the methodology matches before comparing reports. Standard deviation describes how scattered individual trade results are; the smaller, the more predictable each trade.
The Z-score measures the correlation between consecutive wins and losses: a significantly negative value means wins tend to cluster (a streaky strategy), a positive one means wins and losses tend to alternate. It is neither good nor bad in itself, but it reveals the strategy’s “personality” — when a streaky strategy hits a losing run, what is needed may be patient waiting rather than panic-stopping it.
6. A practical checklist: six things to check first
- Is the data verifiable? A live account with a real-time feed (read-only access, third-party verification), or homemade screenshots?
- Is the track record long enough? At least three months, covering both trending and ranging markets, ideally through major news events.
- What is the return methodology? Any cash flows during the period? TWR or a simple return?
- How was drawdown computed? Equity or balance? Daily or minute-level sampling?
- Can profit factor and expectancy survive the costs? Are there enough trades for statistical significance?
- Does the risk fit you? Multiply the reported max drawdown by 1.5 as a stress scenario, and commit only if both your capital and your nerves can take it (position sizing: EA Money Management 101).
The Golden Tiger team applies the same standard to itself: the live section of our homepage publishes real-time data from multiple live accounts, with returns computed as TWR and drawdown from minute-level equity sampling, plus read-only accounts anyone can verify independently. One final reminder: every performance metric describes the past — no automated trading program (EA) can guarantee future profits. Trading involves risk; only participate with money you can afford to lose.
Performance Metrics Quick Reference
| Metric | The question it answers | How to read it |
|---|---|---|
| TWR return | What the strategy itself earned, net of deposits/withdrawals | Simple returns distort when money moves in or out — trust TWR |
| Max drawdown | How deep the most painful stretch went | Use high-frequency equity sampling; imagine it × 1.5 as a stress case |
| Profit factor | How much is won per unit lost | 1.3–1.5 passable, around 2 excellent — with enough trades behind it |
| Deposit/withdrawal log | Whether deposits are dressing up the numbers | Read returns separately from cash flows — a deposit is not profit |
Frequently Asked Questions
What is the difference between TWR and a simple return?
A simple return mixes cash flows with strategy performance, so the number distorts whenever money moves in or out. TWR cuts the timeline at every deposit or withdrawal, computes each segment’s return and chains them by multiplication, measuring how well the strategy grows each dollar. Because it is immune to the size and timing of cash flows, it is the right tool for comparing strategies across accounts and periods.
How much max drawdown is acceptable?
There is no universal number; what matters is that it is proportionate to the return and within your tolerance. A practical rule: multiply the reported max drawdown by 1.5 as a stress scenario — if that figure would keep you up at night or force you to switch the strategy off at the bottom, the position is too large or the strategy is not for you. Also confirm the drawdown was computed on equity with high-frequency sampling; otherwise it may be understated.
How high should the profit factor be?
1 is break-even; 1.3–1.5 or above passes as reasonably solid; sustaining around 2 long-term is excellent. But a profit factor only carries statistical meaning with enough trades (at least several dozen). A report showing an extreme profit factor on a dozen trades should be read as an insufficient sample, not a superior strategy.
This guide is one stop on The Gold EA Learning Path. Head back to the learning path to pick your next read.
Further reading: why can one account show several different return figures? See TWR vs Absolute Return vs ROI vs MWRR.